


Insights
Driving After-Sales Service Upgrades with Warranty Data: Quality Feedback
2026-10-02 09:35:23
Warranty data is often underestimated because companies tend to use it only to identify problems, without taking the next step to ask, “Why did it happen?” Was it caused by a design defect, a manufacturing process issue, or the quality of a supplier component? This article explores how to move from “what happened” to “why it happened”: by establishing a four-level analysis framework that progressively narrows the focus from lifecycle-wide trends to the root cause of a single component, and feeds the findings back into the design and manufacturing of next-generation products.
1. Data Foundation: Service Data and Supplemental Data
Before establishing analytical metrics such as CFR and AFR, the data itself must first be structured. Warranty data can be divided into two major categories: service data and supplemental data. Companies need to integrate both through a data collection system as the raw input for subsequent quality analysis.
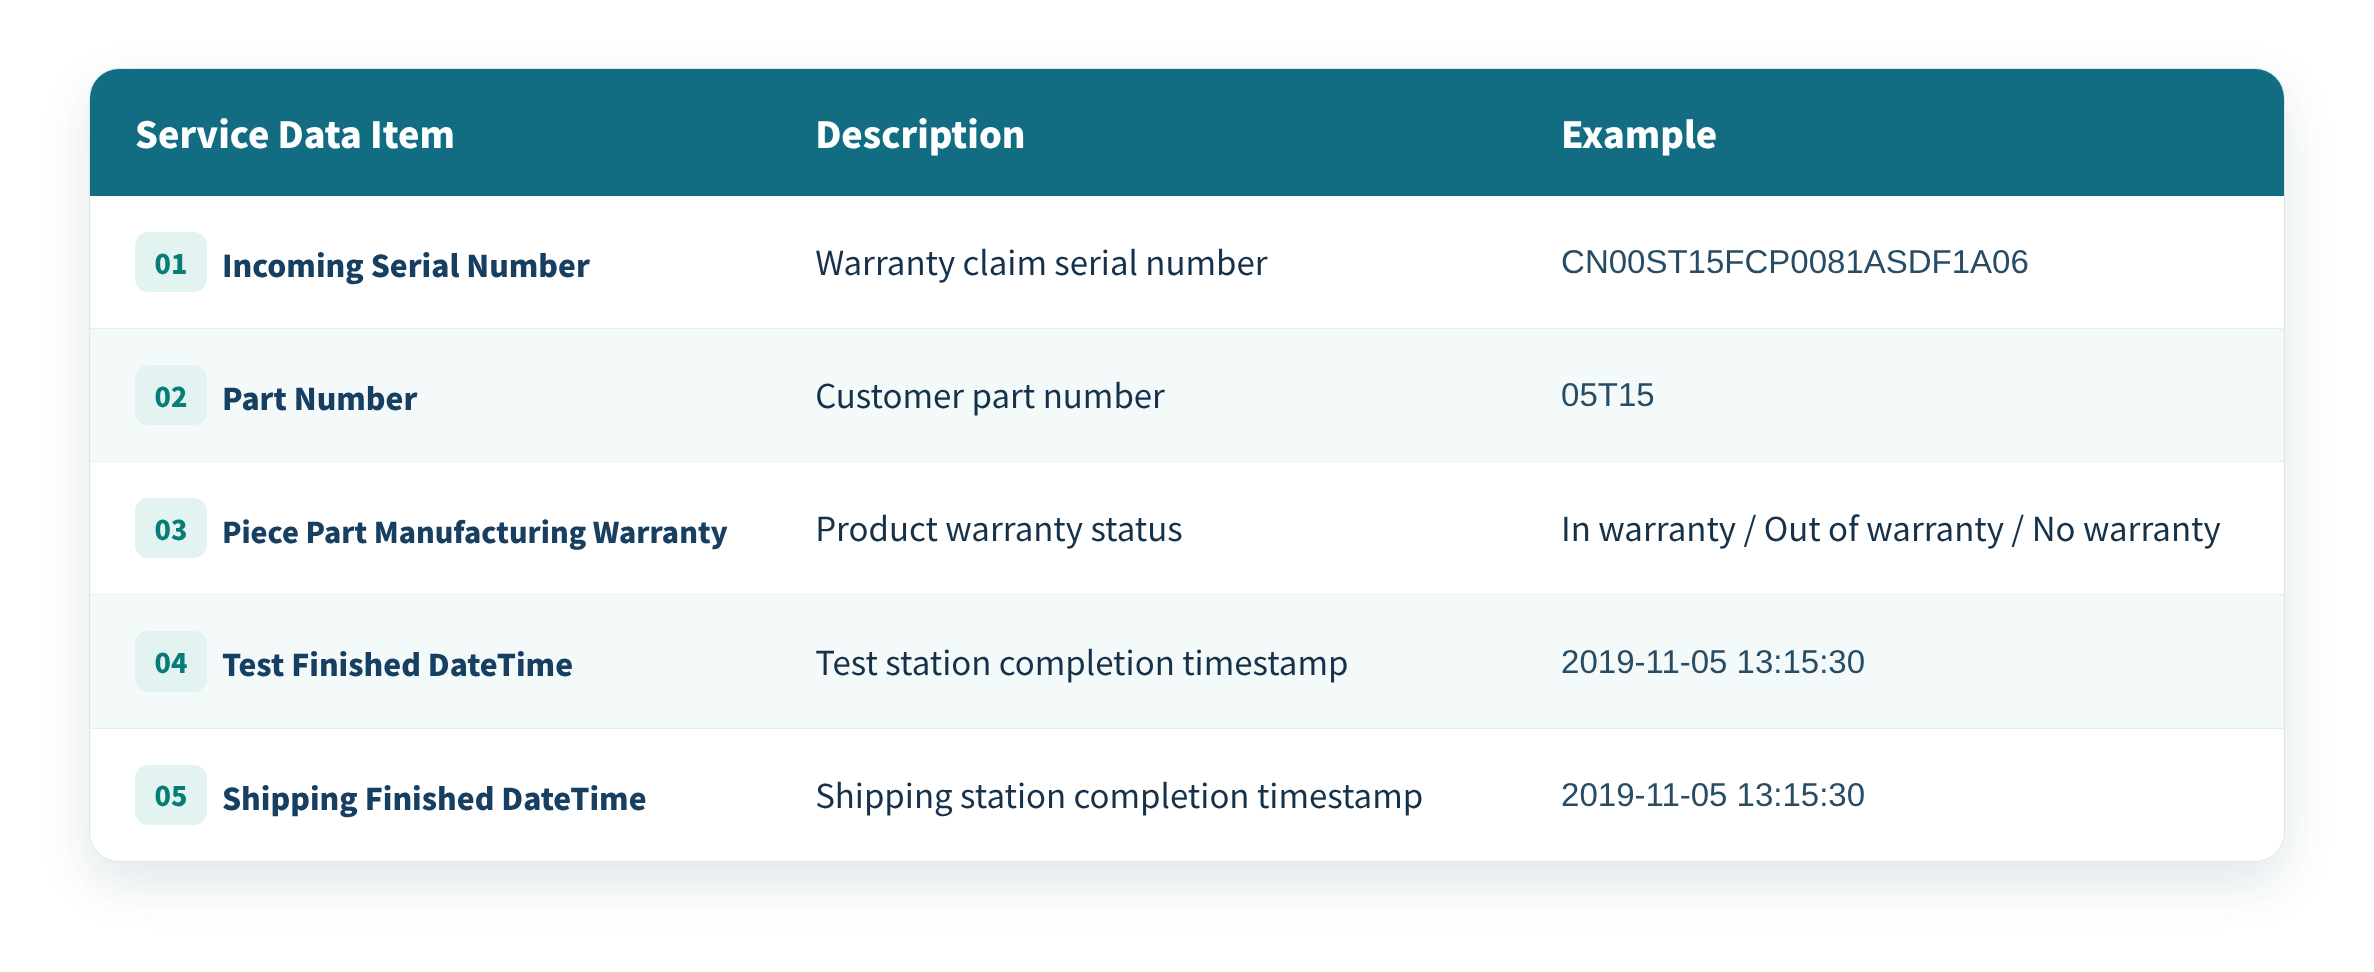
➤ | Service Data: Records collected during the warranty period from applications, claims, and repair services. These records can be obtained directly from the after-sales warranty system and mainly include five categories: product warranty data, warranty claim data, failure environment data, repair service data, and service cost data. The table below provides examples of fields in this type of data: | |||
Table 1: Repair Service Data Example | ||||
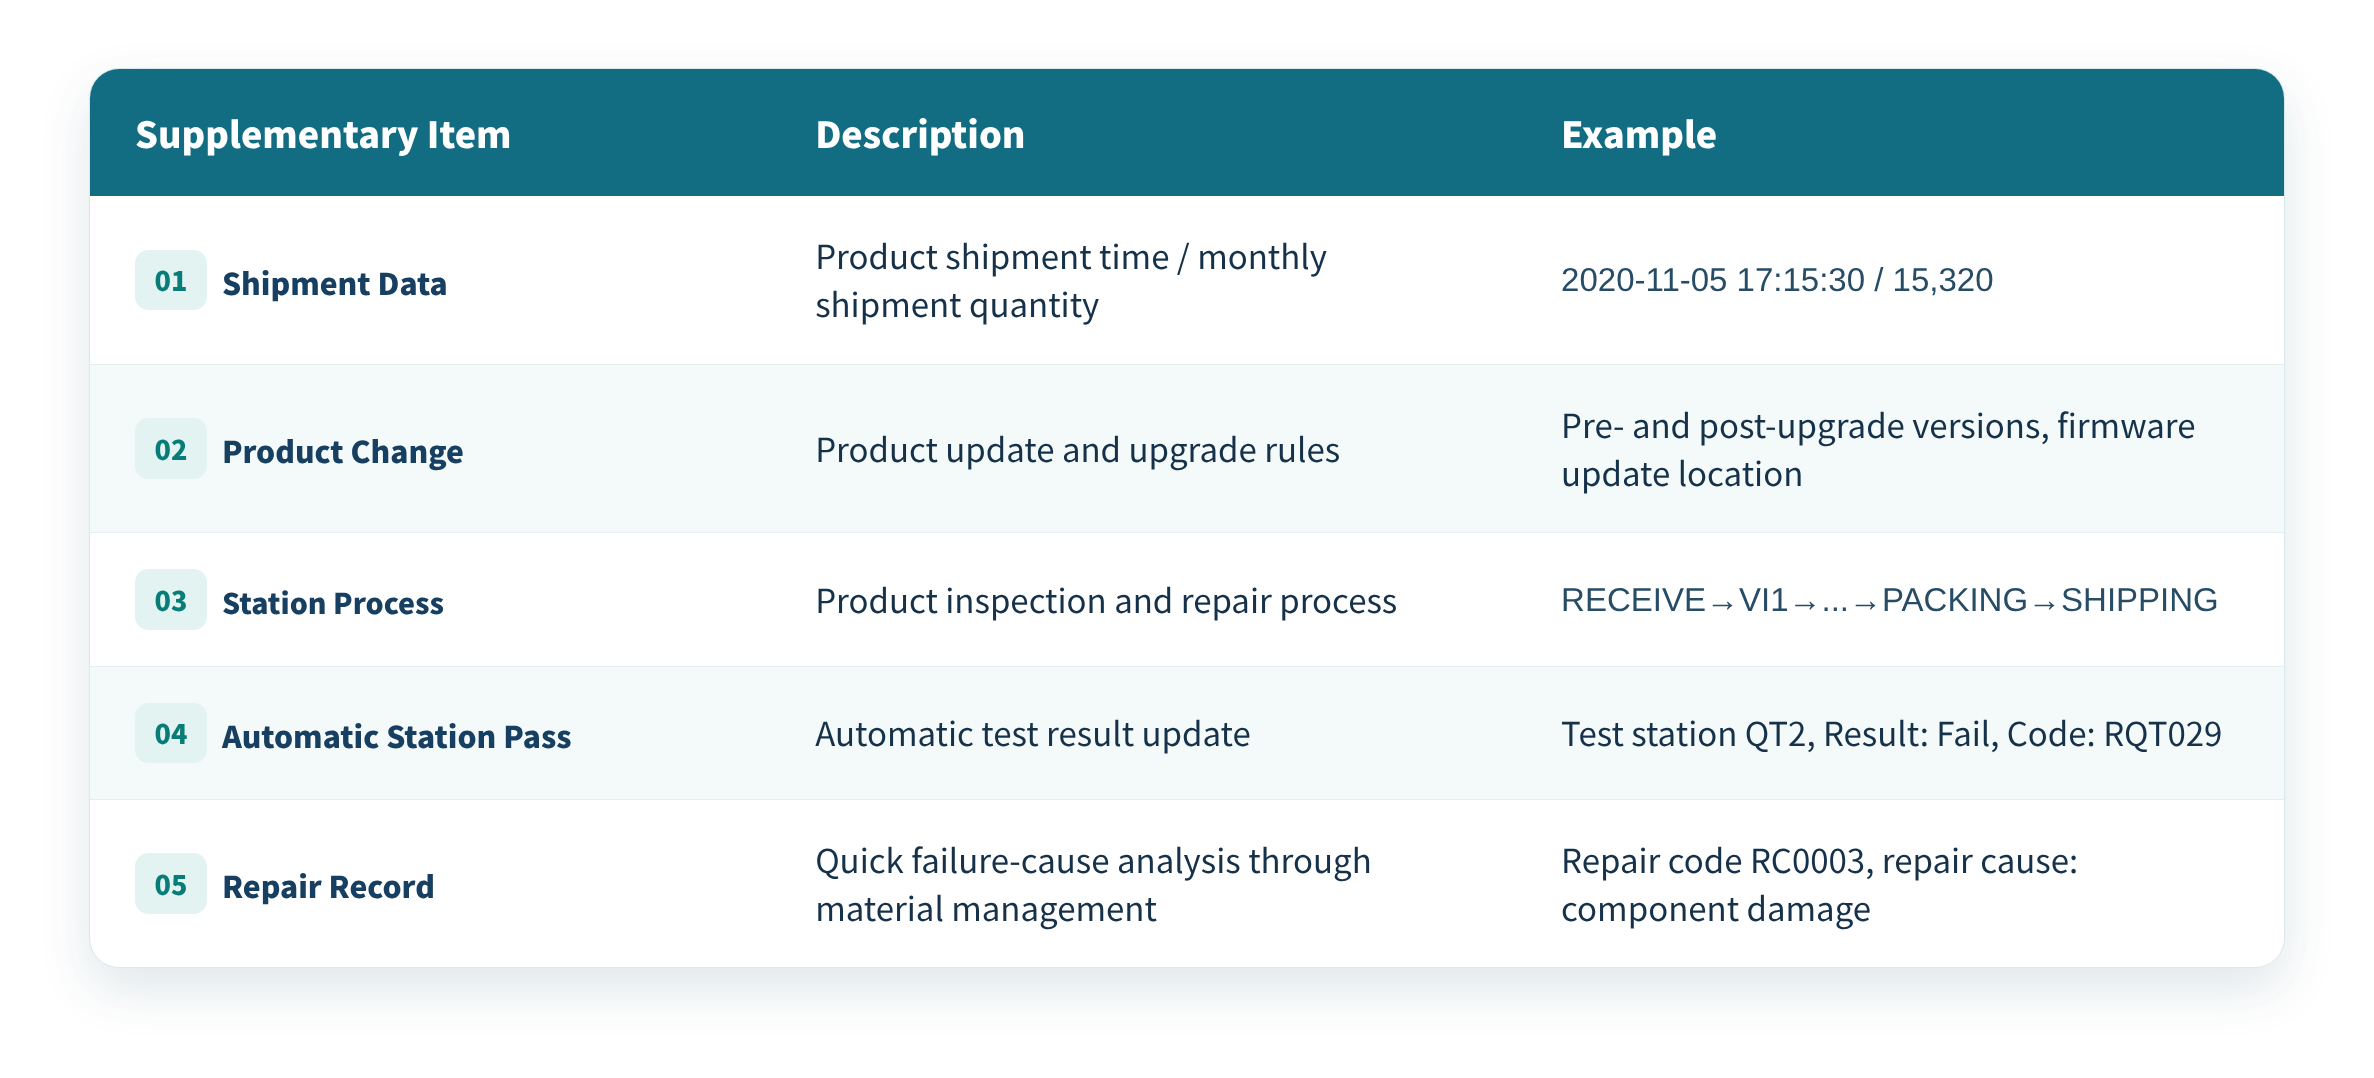
➤ | Supplemental Data: Supplementary information related to production, such as product and manufacturing data. Sources mainly include internal development, engineering, and production departments, as well as external suppliers and distributors. The data mainly consists of four categories: reference product data, product design data, production-related data, and marketing data. | |||
Table 2: Production-Related Data Example | ||||
In addition to the classifications above, data can also be structured in three ways, each answering a different question: | ||||
➤ | Product Serial Number (Case Traceability): Tracks the complete lifecycle of a single product, from shipment to repair request, answering the question, “Why did this unit fail?” | |||
➤ | Production Batch (Cross-Sectional Comparison): Compares the concentration of failures among products from the same production period, answering the question, “Is there a problem with this batch?” | |||
➤ | Month (Time-Series Analysis): Observes overall trends over time, answering the question, “Is the situation getting better or worse?” | |||
2. From Data Collection to the Analysis Framework: Overview of the Quality Analysis Pyramid
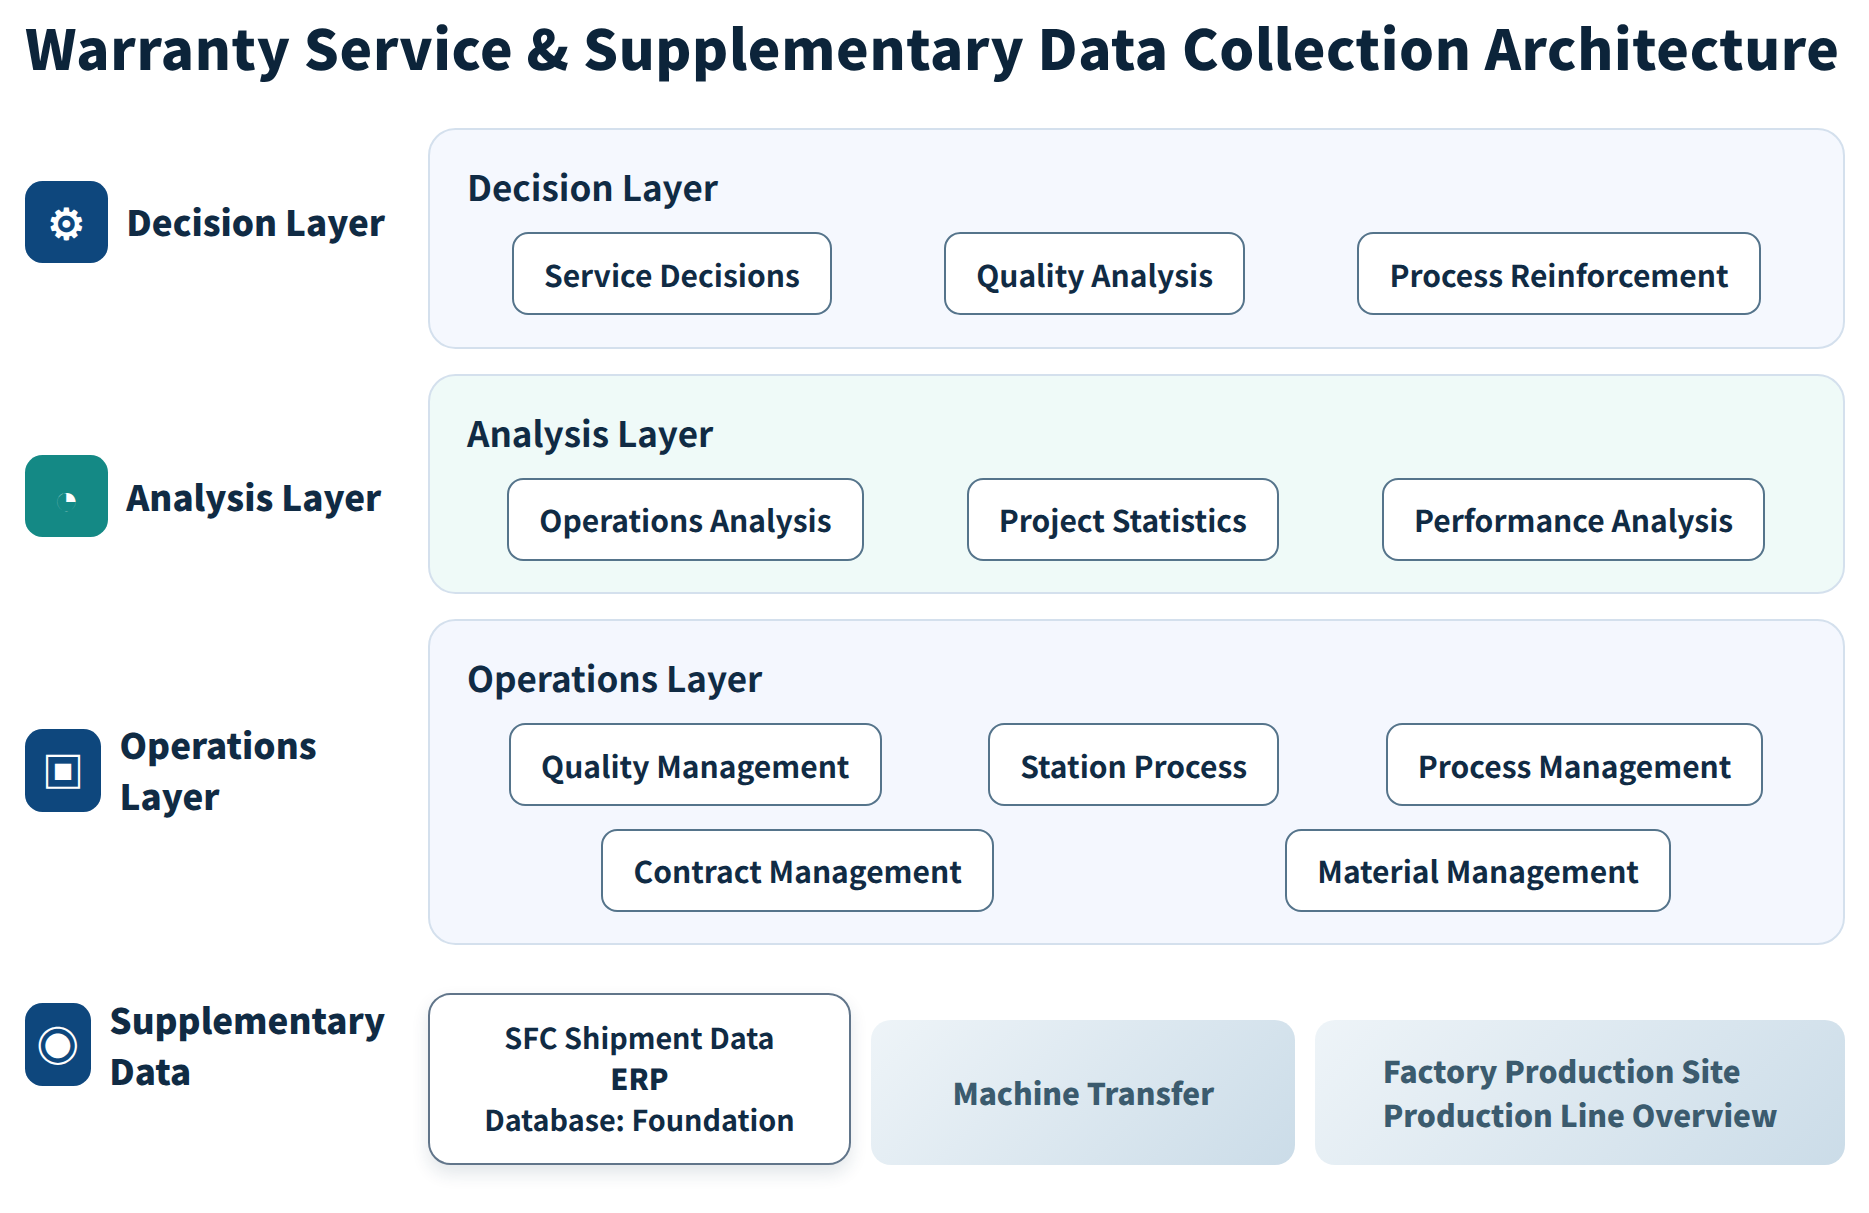
With service data and supplemental data in place, companies also need to establish a data collection system that integrates both into a unified management framework:
Figure 1: Warranty Service and Supplemental Data Collection System Architecture | ||||
This diagram divides the path from data collection to application into four layers: supplemental data comes from systems such as SFC, ERP, and databases; the operational layer consists of daily records such as spare parts, workstations, and contracts; the analysis layer breaks these records down into interpretable metrics; and the decision layer converts the analysis results into concrete improvement actions. | ||||
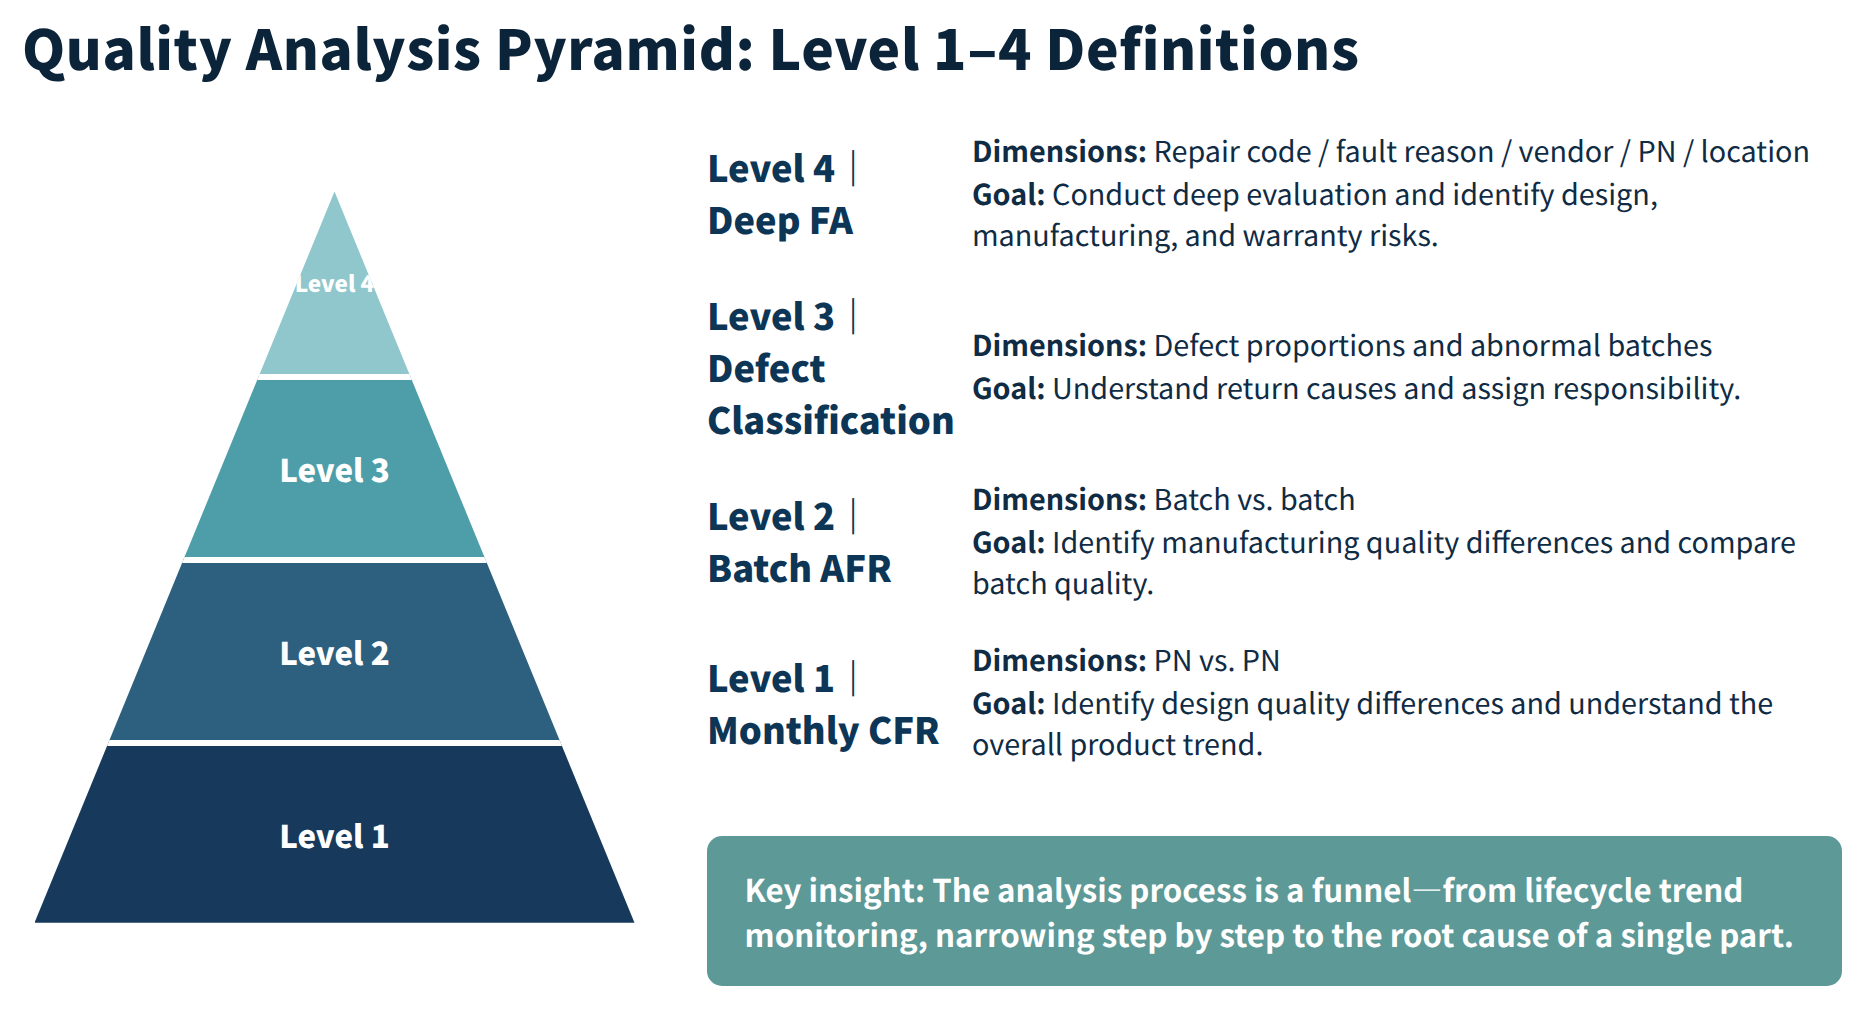
The analysis layer at the top of this architecture is precisely the scope of quality analysis. Specifically, quality analysis can be understood as a pyramid that progressively narrows from macro trends across the entire lifecycle to the root cause of a single component: | ||||
Figure 2: Overview of Quality Analysis Pyramid Level 1–4 Definitions | ||||
Batch comparisons using AFR, responsibility attribution in defect determination, and field-level analysis in in-depth FA all require supplemental data to distinguish among design, manufacturing, and supplier causes. This is the data foundation behind the progressive narrowing from Level 1 through Level 4. |
3. Breaking Down the Four Root-Cause Levels: CFR, AFR, Defect Determination, and In-Depth FA
3.1 Level 1: CFR — Identifying Design Quality Differences | ||||
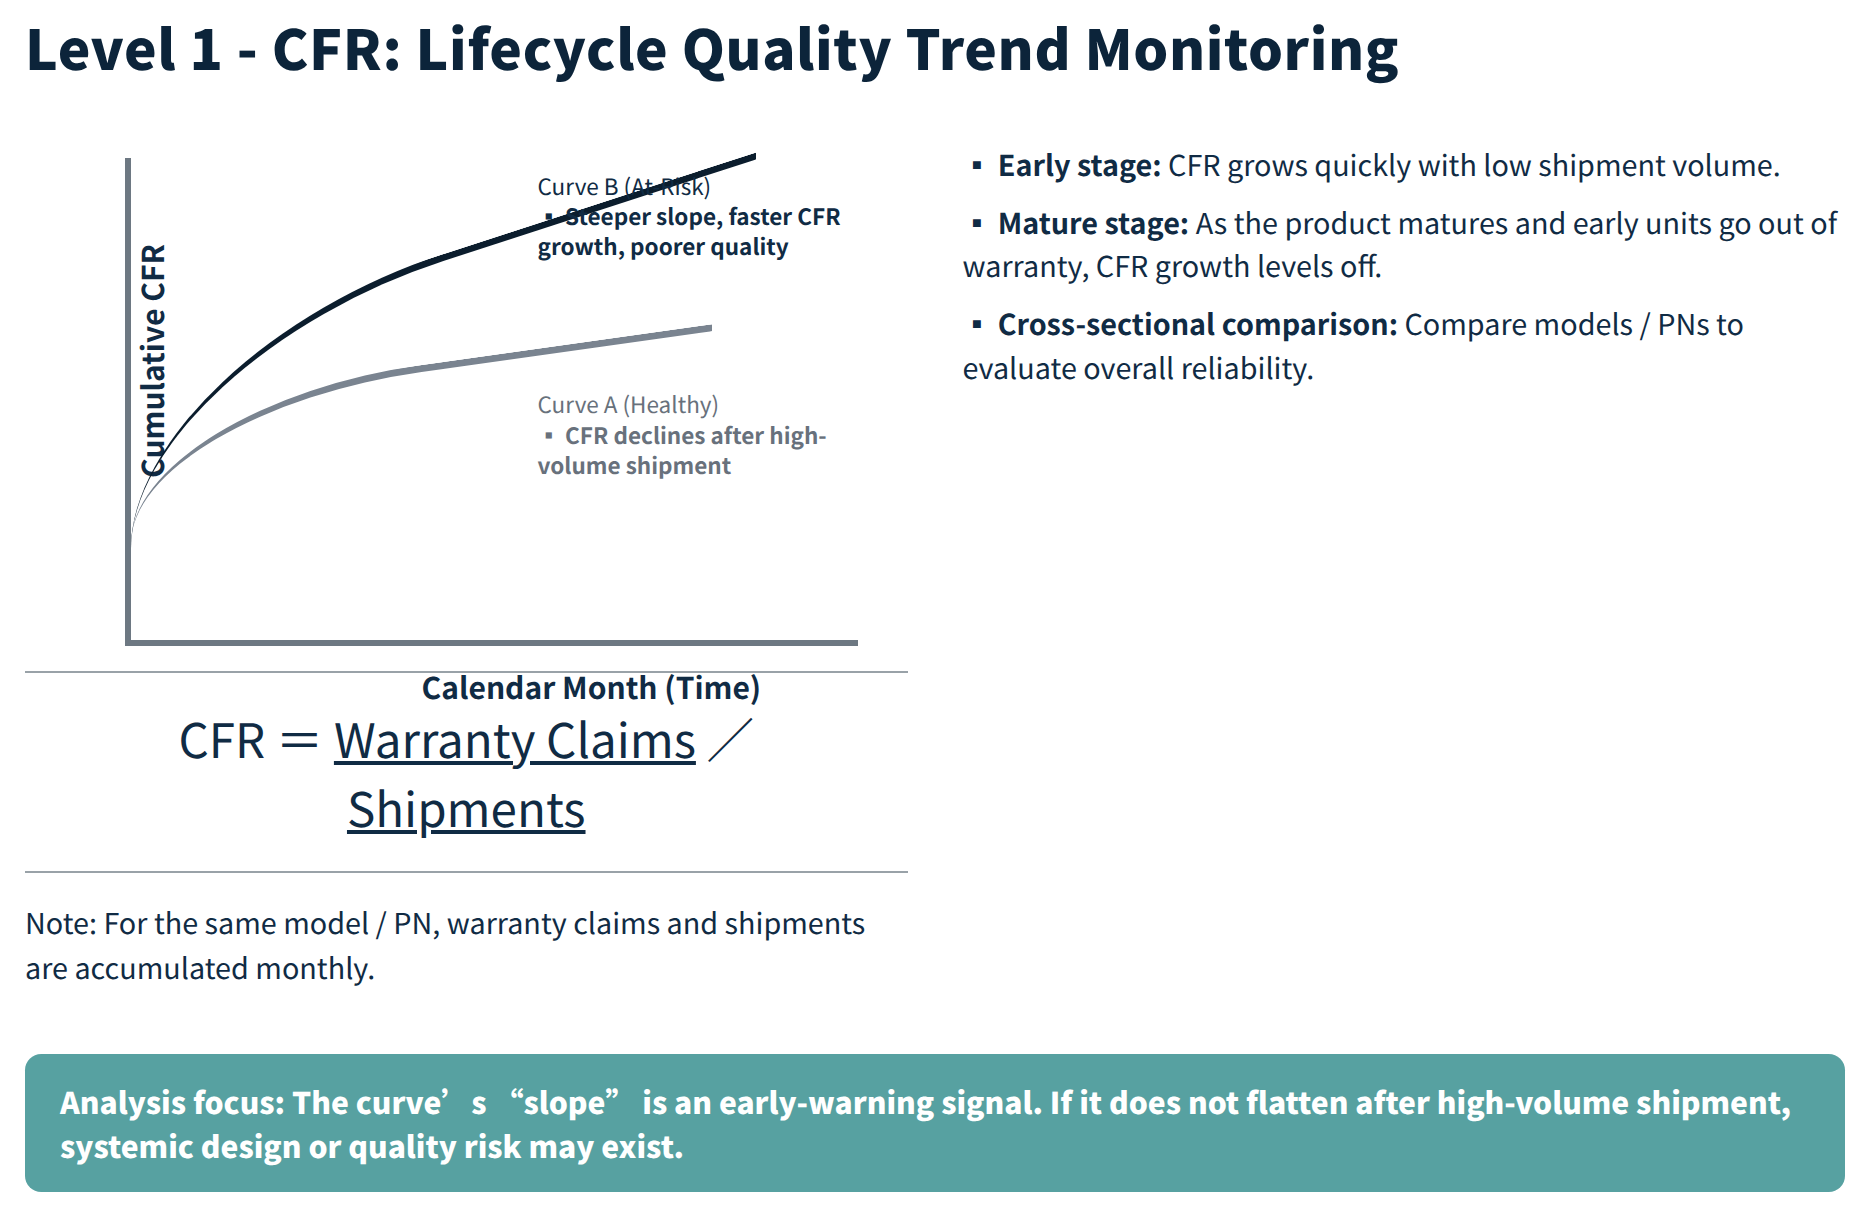
CFR (Cumulative Failure Rate) is calculated by dividing the number of warranty claims by the number of units shipped and accumulating the results month by month to form a trend curve. It is used to compare design quality differences among different PNs. | ||||
Figure 3: CFR Lifecycle-Wide Quality Trend Monitoring | ||||
3.2 Level 2: AFR — Identifying Manufacturing Quality Differences | ||||
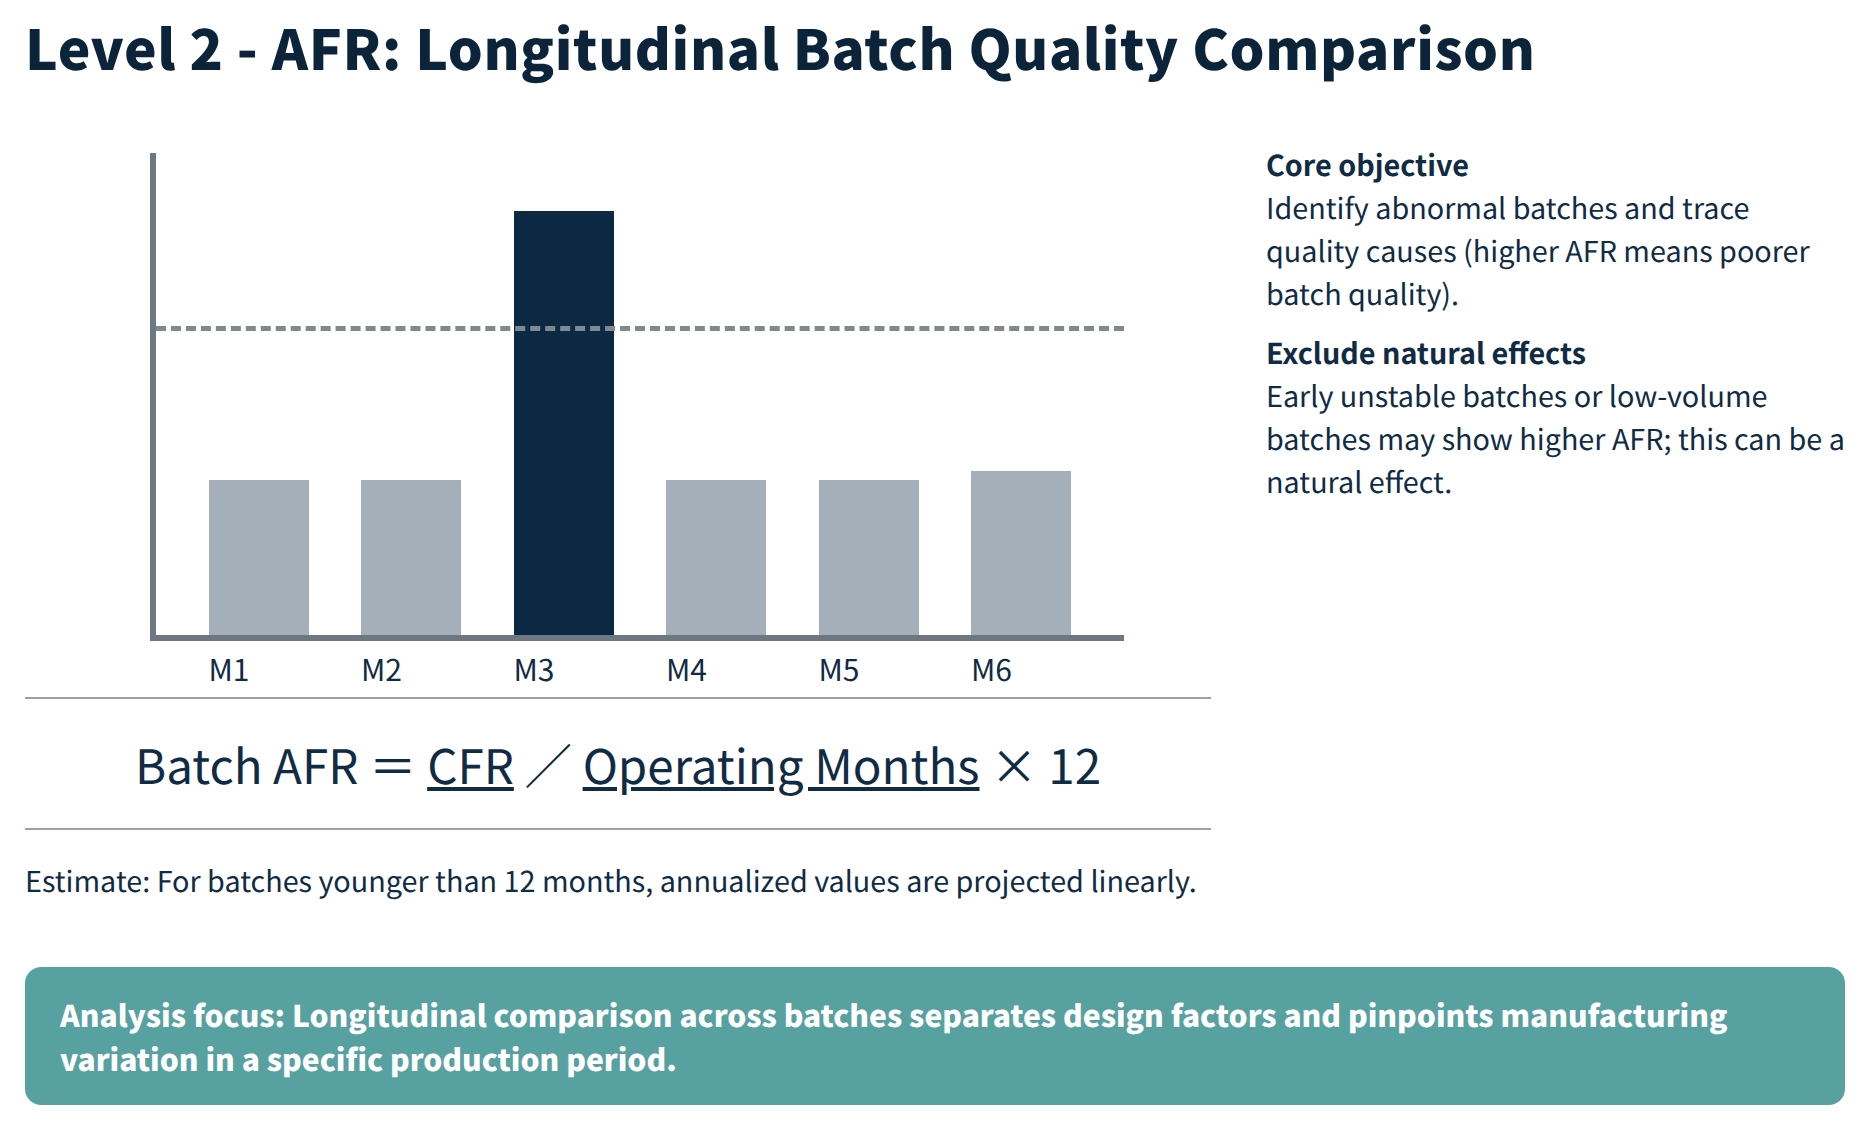
AFR (Annualized Failure Rate) is derived using MTBF and the survival function, allowing products from different batches and with different shipment volumes to be compared on the same basis for manufacturing quality. The survival function R(t)=e^(-t/MTBF) essentially assumes that the product is in a random failure period where h(t) is approximately constant; CFR, in contrast, is a raw empirical rate without model assumptions. Used together, one shows trends while the other enables cross-sectional comparison. | ||||
Figure 4: Longitudinal Comparison of Batch AFR | ||||
3.3 Level 3: Defect Determination — First Clarify Responsibility | ||||
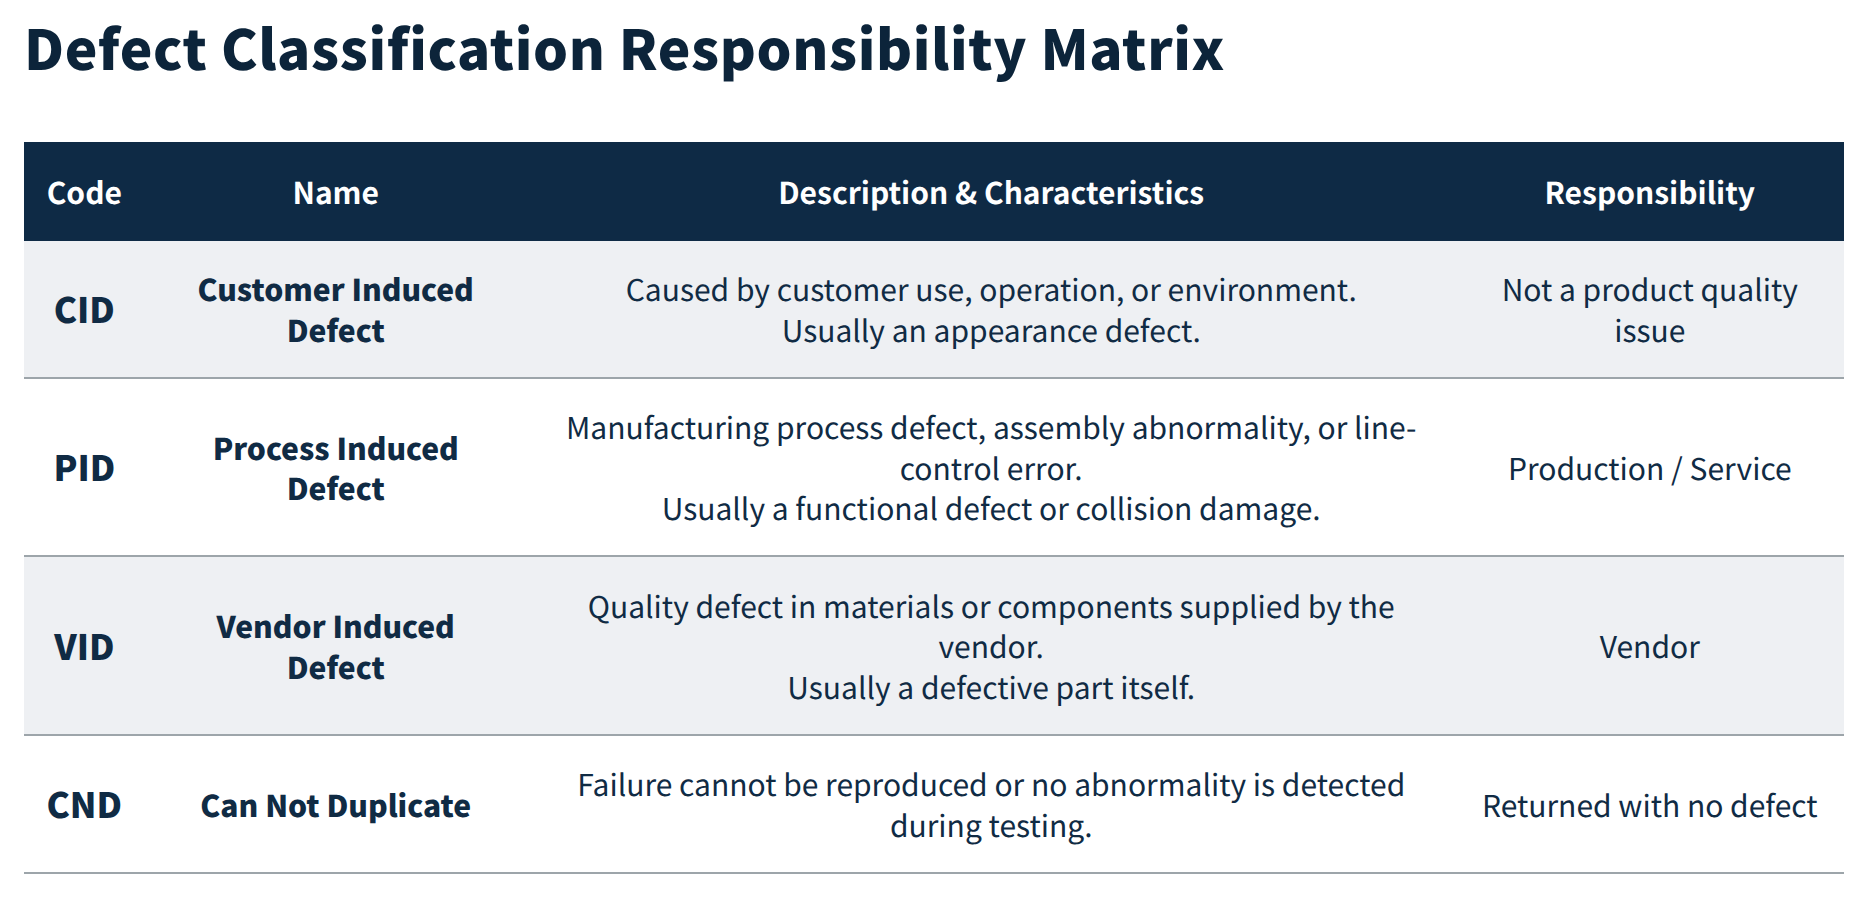
The purpose of defect determination at the third level of the pyramid is to first clarify which party should be responsible for the returned item before conducting an in-depth root-cause analysis, thereby avoiding misallocation of subsequent analysis resources. Common classification methods include: | ||||
Figure 5: Defect Determination Responsibility Attribution Matrix | ||||
Proper classification must come first to ensure that subsequent analysis addresses the right cause. If a CID (Customer-Induced Cause) is mistakenly classified as a PID (Process-Induced Cause) and the production line is investigated in depth, it not only wastes resources but may also lead to unnecessary process adjustments. | ||||
3.4 Level 4: In-Depth FA — Targeted Root-Cause Analysis | ||||
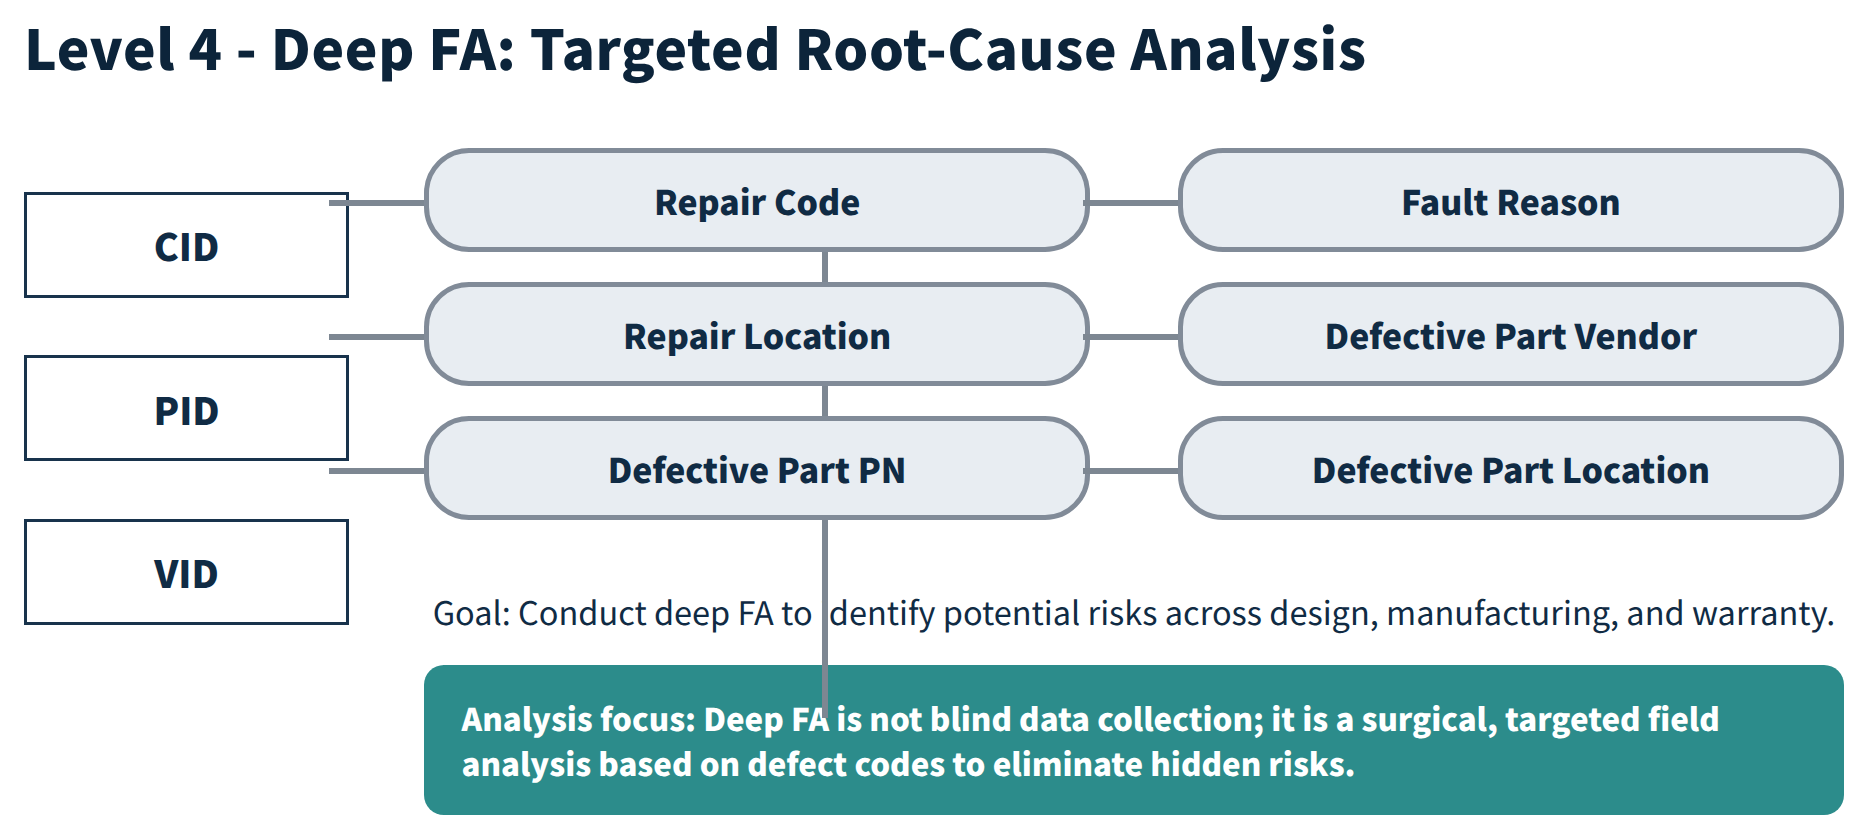
The final level of the pyramid, in-depth FA (Failure Analysis), analyzes data layer by layer across dimensions such as repair codes, failure causes, suppliers, and component PNs to identify potential risks across three major dimensions: design, manufacturing, and warranty. Common tools such as fishbone diagrams (systematically listing possible causes) and Pareto charts (ranking causes by occurrence rate and prioritizing key causes) can locate the root of a problem from different perspectives. The dashboard shows “where the anomaly is,” while this toolkit answers “why the anomaly occurred.” | ||||
Figure 6: Field-Level Analysis Path for In-Depth FA |
4. Feeding Conclusions Back to Manufacturing and Design
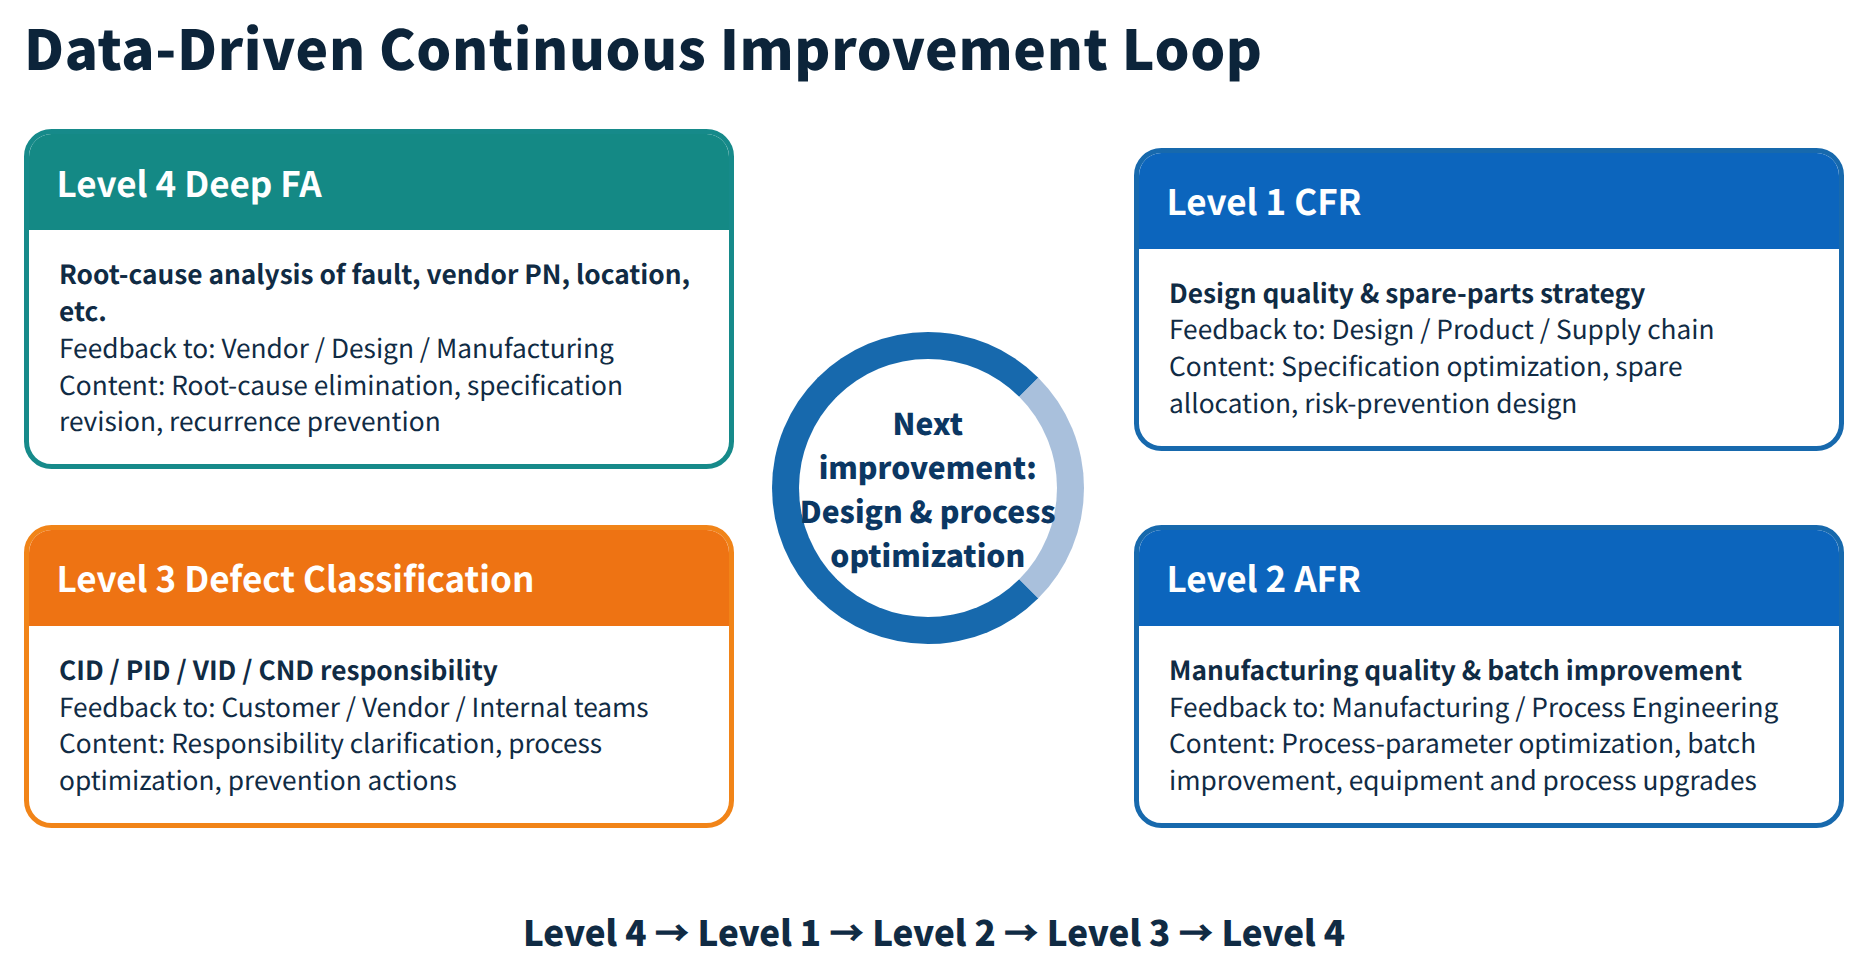
Finding the root cause through in-depth FA is only halfway through the analysis. If the conclusions stop at the report, the next batch of products may make the same mistakes again. The real value lies in translating the conclusions from Levels 3 and 4 into concrete actions based on responsibility attribution:
➤ | PID (Process-Induced Cause): Feed findings back to the production line and manufacturing departments, including process parameters, SOP adjustment recommendations, and whether production should be suspended to inspect fixtures or equipment. | |||
➤ | VID (Vendor-Induced Cause): Feed findings back to procurement and supplier quality teams, including the supplier of defective parts, PN, and batch number, as a basis for supplier audits and incoming inspection adjustments. | |||
➤ | CID (Customer-Induced Cause): Feed findings back to the design team and customer service/training departments, including common misuse scenarios, to optimize user manuals, error-proofing designs, or training priorities. | |||
For the feedback loop to truly work, the key is to structure the analysis conclusions. Reports should be generated using standardized fields (responsibility category, root cause, recommended action, and responsible department) so that each root cause can be tracked to determine whether it was actually adopted and what results it achieved. | ||||
The endpoint of the quality analysis pyramid should not be merely a report, but the reintegration of its findings into the design and manufacturing processes of next-generation products: | ||||
Figure 7: Data-Driven Continuous Improvement Loop | ||||
Conclusion: From Root-Cause Analysis to Driving Improvement
The value of the quality analysis pyramid lies not in producing a polished analysis report, but in ensuring that the conclusion at each level reaches the department responsible for taking action: CFR and AFR help identify whether a problem lies in design or manufacturing; defect determination first clarifies responsibility; and in-depth FA narrows the root cause down to specific components and suppliers. The four levels are closely interconnected, and if any level is missing, subsequent judgments can easily become inaccurate. This “reverse maintenance” mindset transforms warranty data from merely an operational record of the after-sales function into an asset that drives continuous product improvement. It is also a key step in moving warranty management from a compliance obligation toward a core source of enterprise competitiveness.
If you would like to learn more about how wareconn helps enterprises establish quality analysis and root-cause feedback mechanisms, please visit the wareconn website (www.wareconn.com) to learn more about its full range of features, or contact service@wareconn.com, and we would be happy to arrange a further discussion.
Author
Wareconn Editorial Department

Driving After-Sales Service Upgrades with Warranty Data: Quality Feedback.pdf
Reference
- Albert Liao, (2022),Warranty Chain Management - Digitalization and Sustainability, Springer.